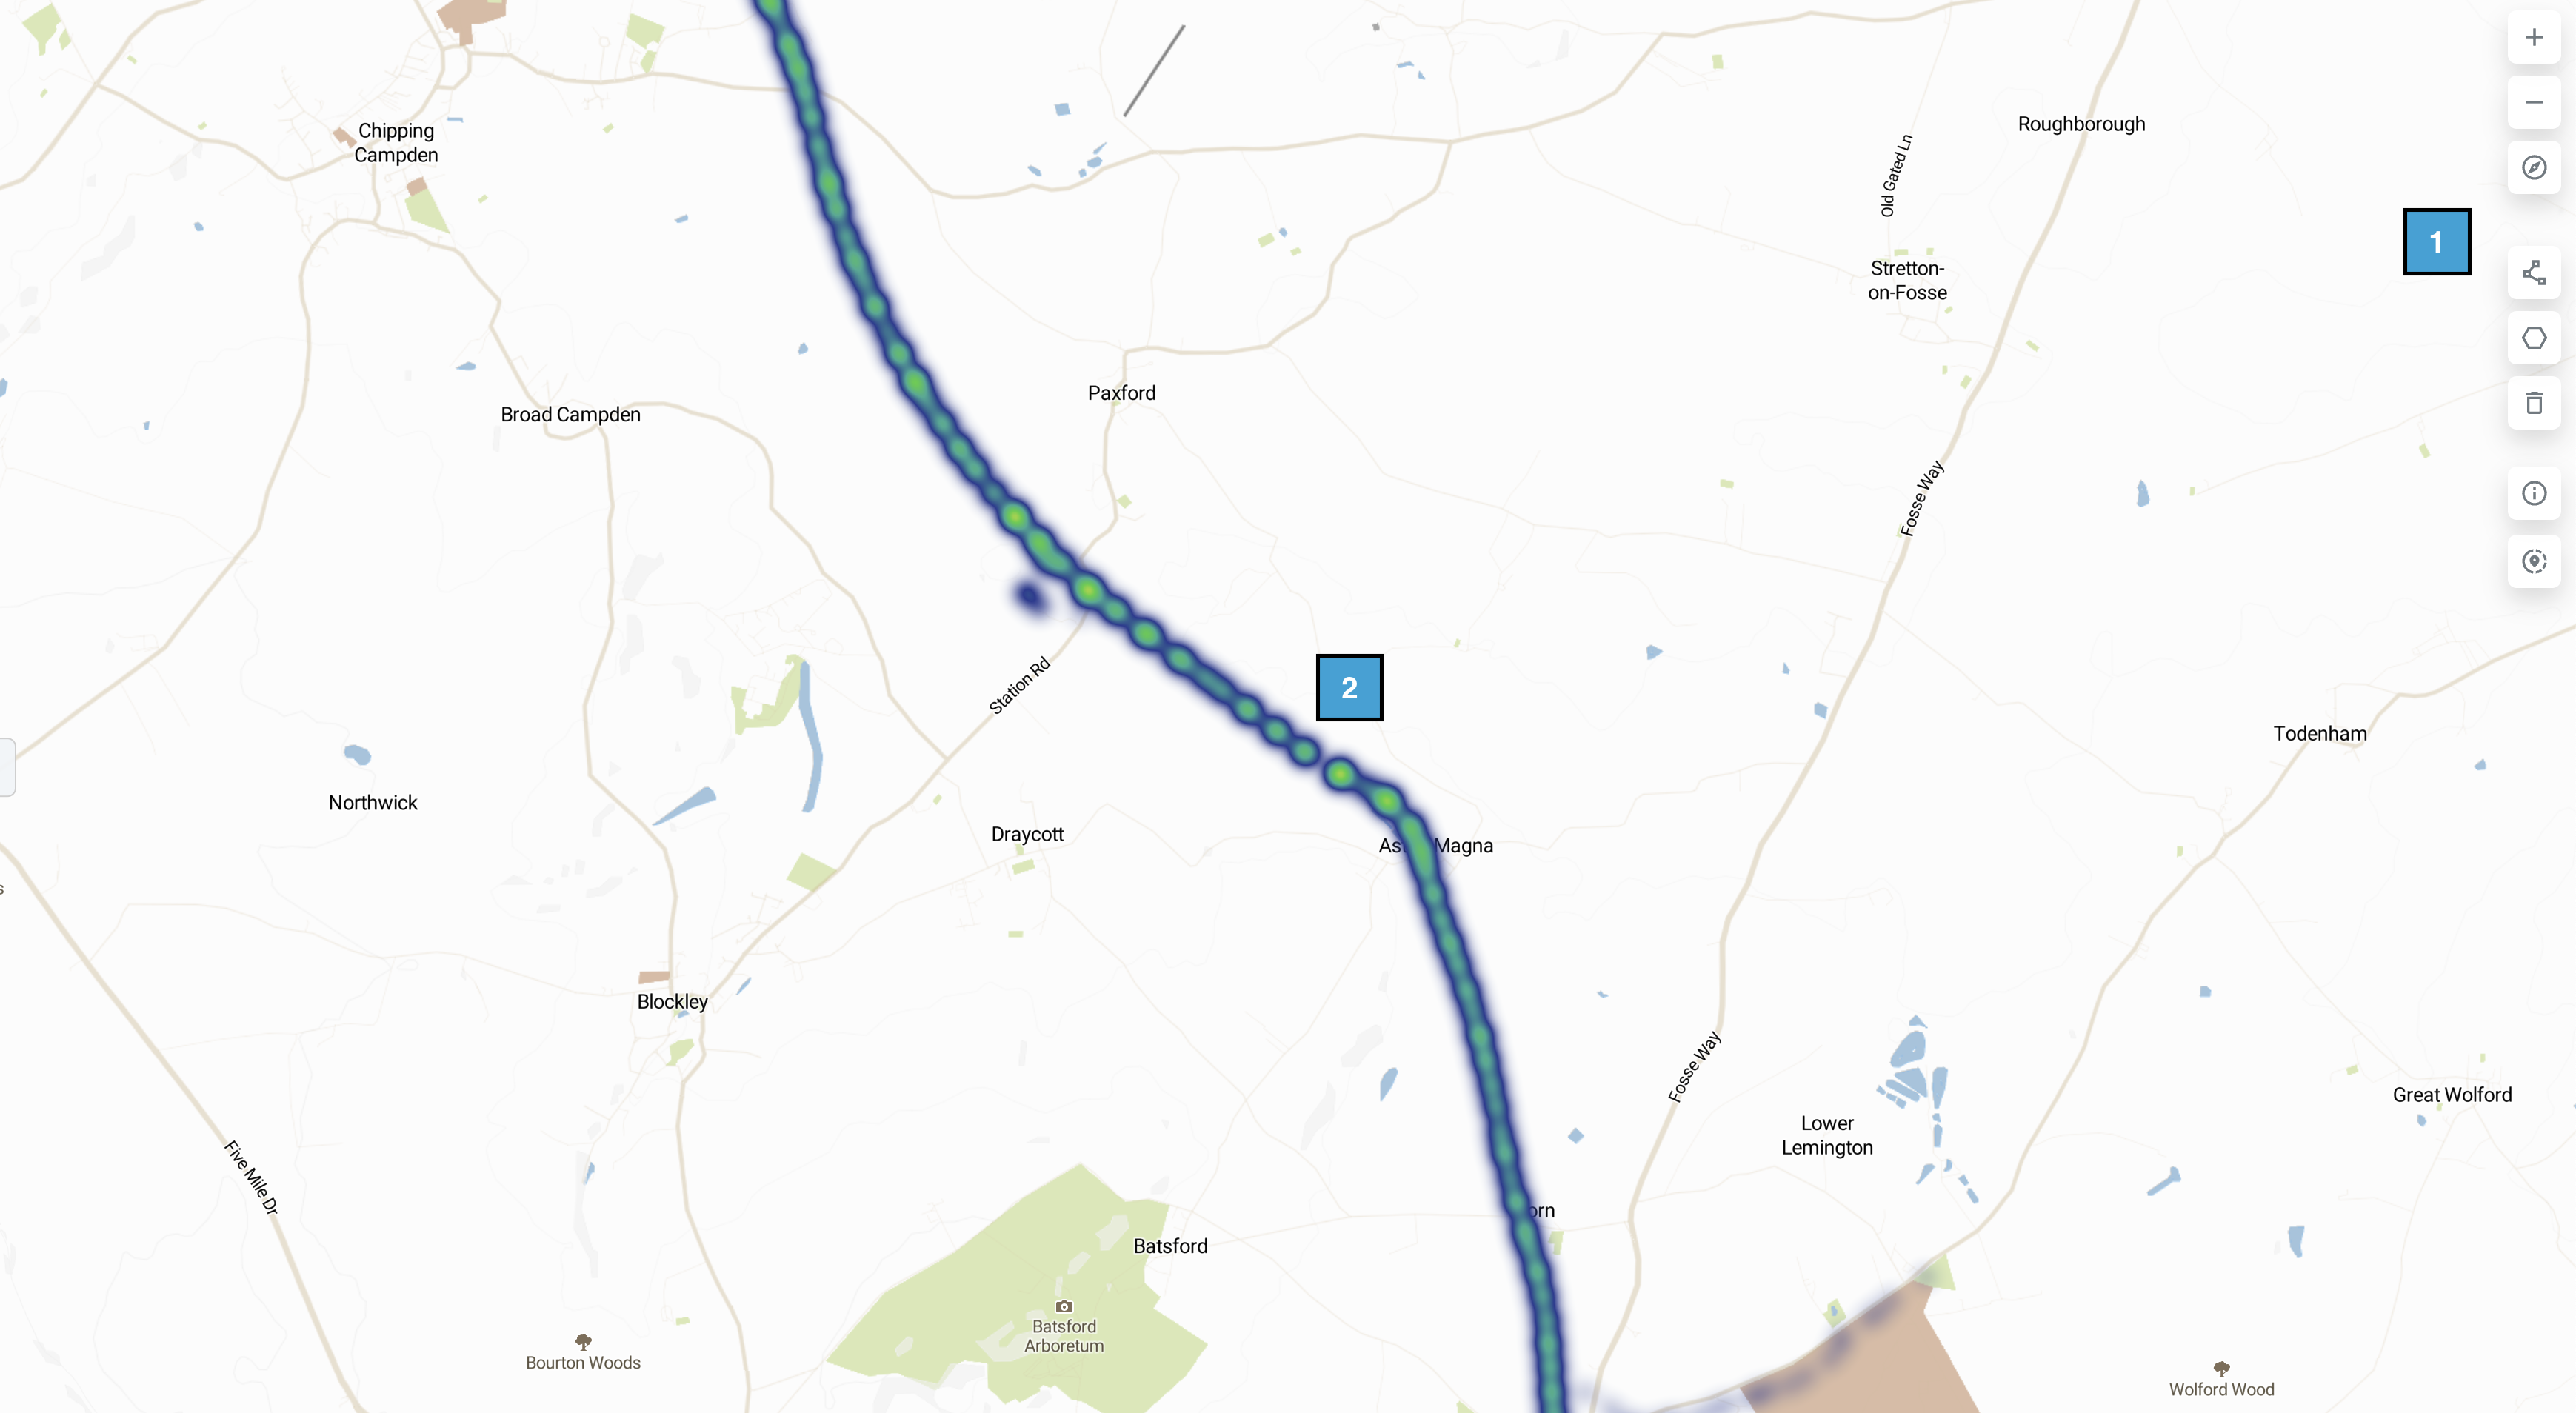
Once launched, you will see a satellite map of the UK with your asset highlighted as a heatmap.
|
1️⃣ |
Menu Bar: Using the menu bar on the right hand side of the screen to select the appropriate tool |
|
2️⃣ |
Heat Map: The Heat map is a cluster of linear images highlighting the asset |
As you move your mouse closer to the route, you will see the heatmap become a series of lighter circles and eventually these circles disperse to become a number of orange dots. Each of these orange dots represents an image.
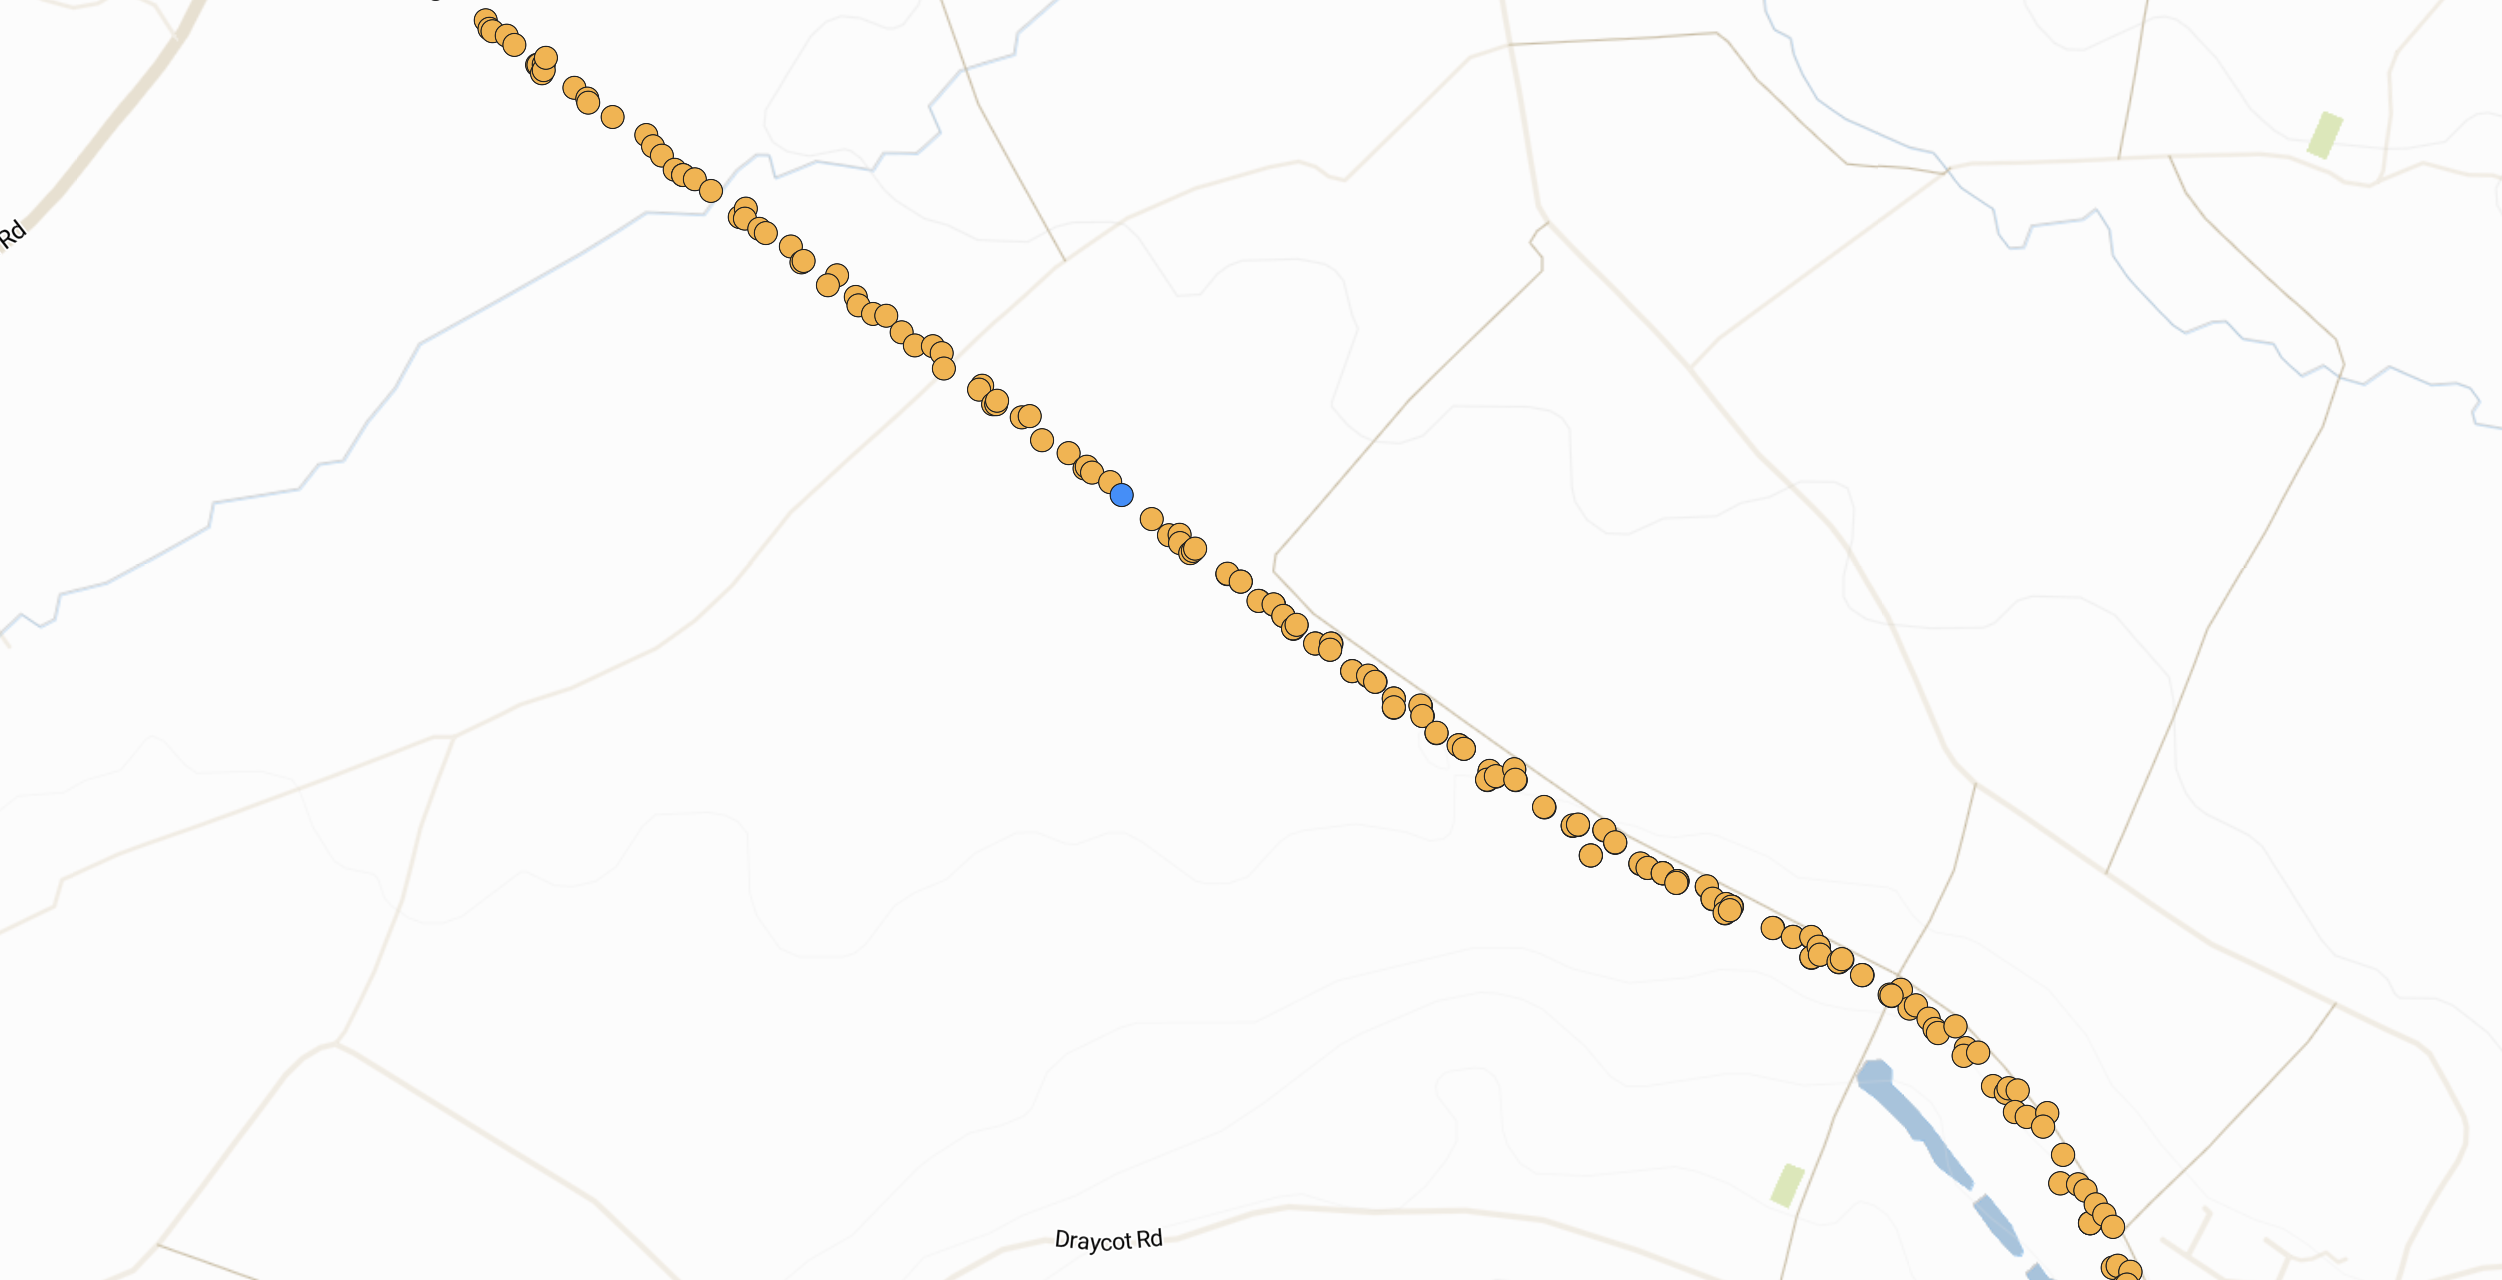
Click on an orange dot close to the location of interest and you will see the image appear in the card to the right of the screen.
The blue dot is the view point and the blue arrow dot is the camera point and direction the image was taken. The white dots with the arrows inside represent images that contain the same viewpoint as the current selected image to enable viewing of the location from different angles.
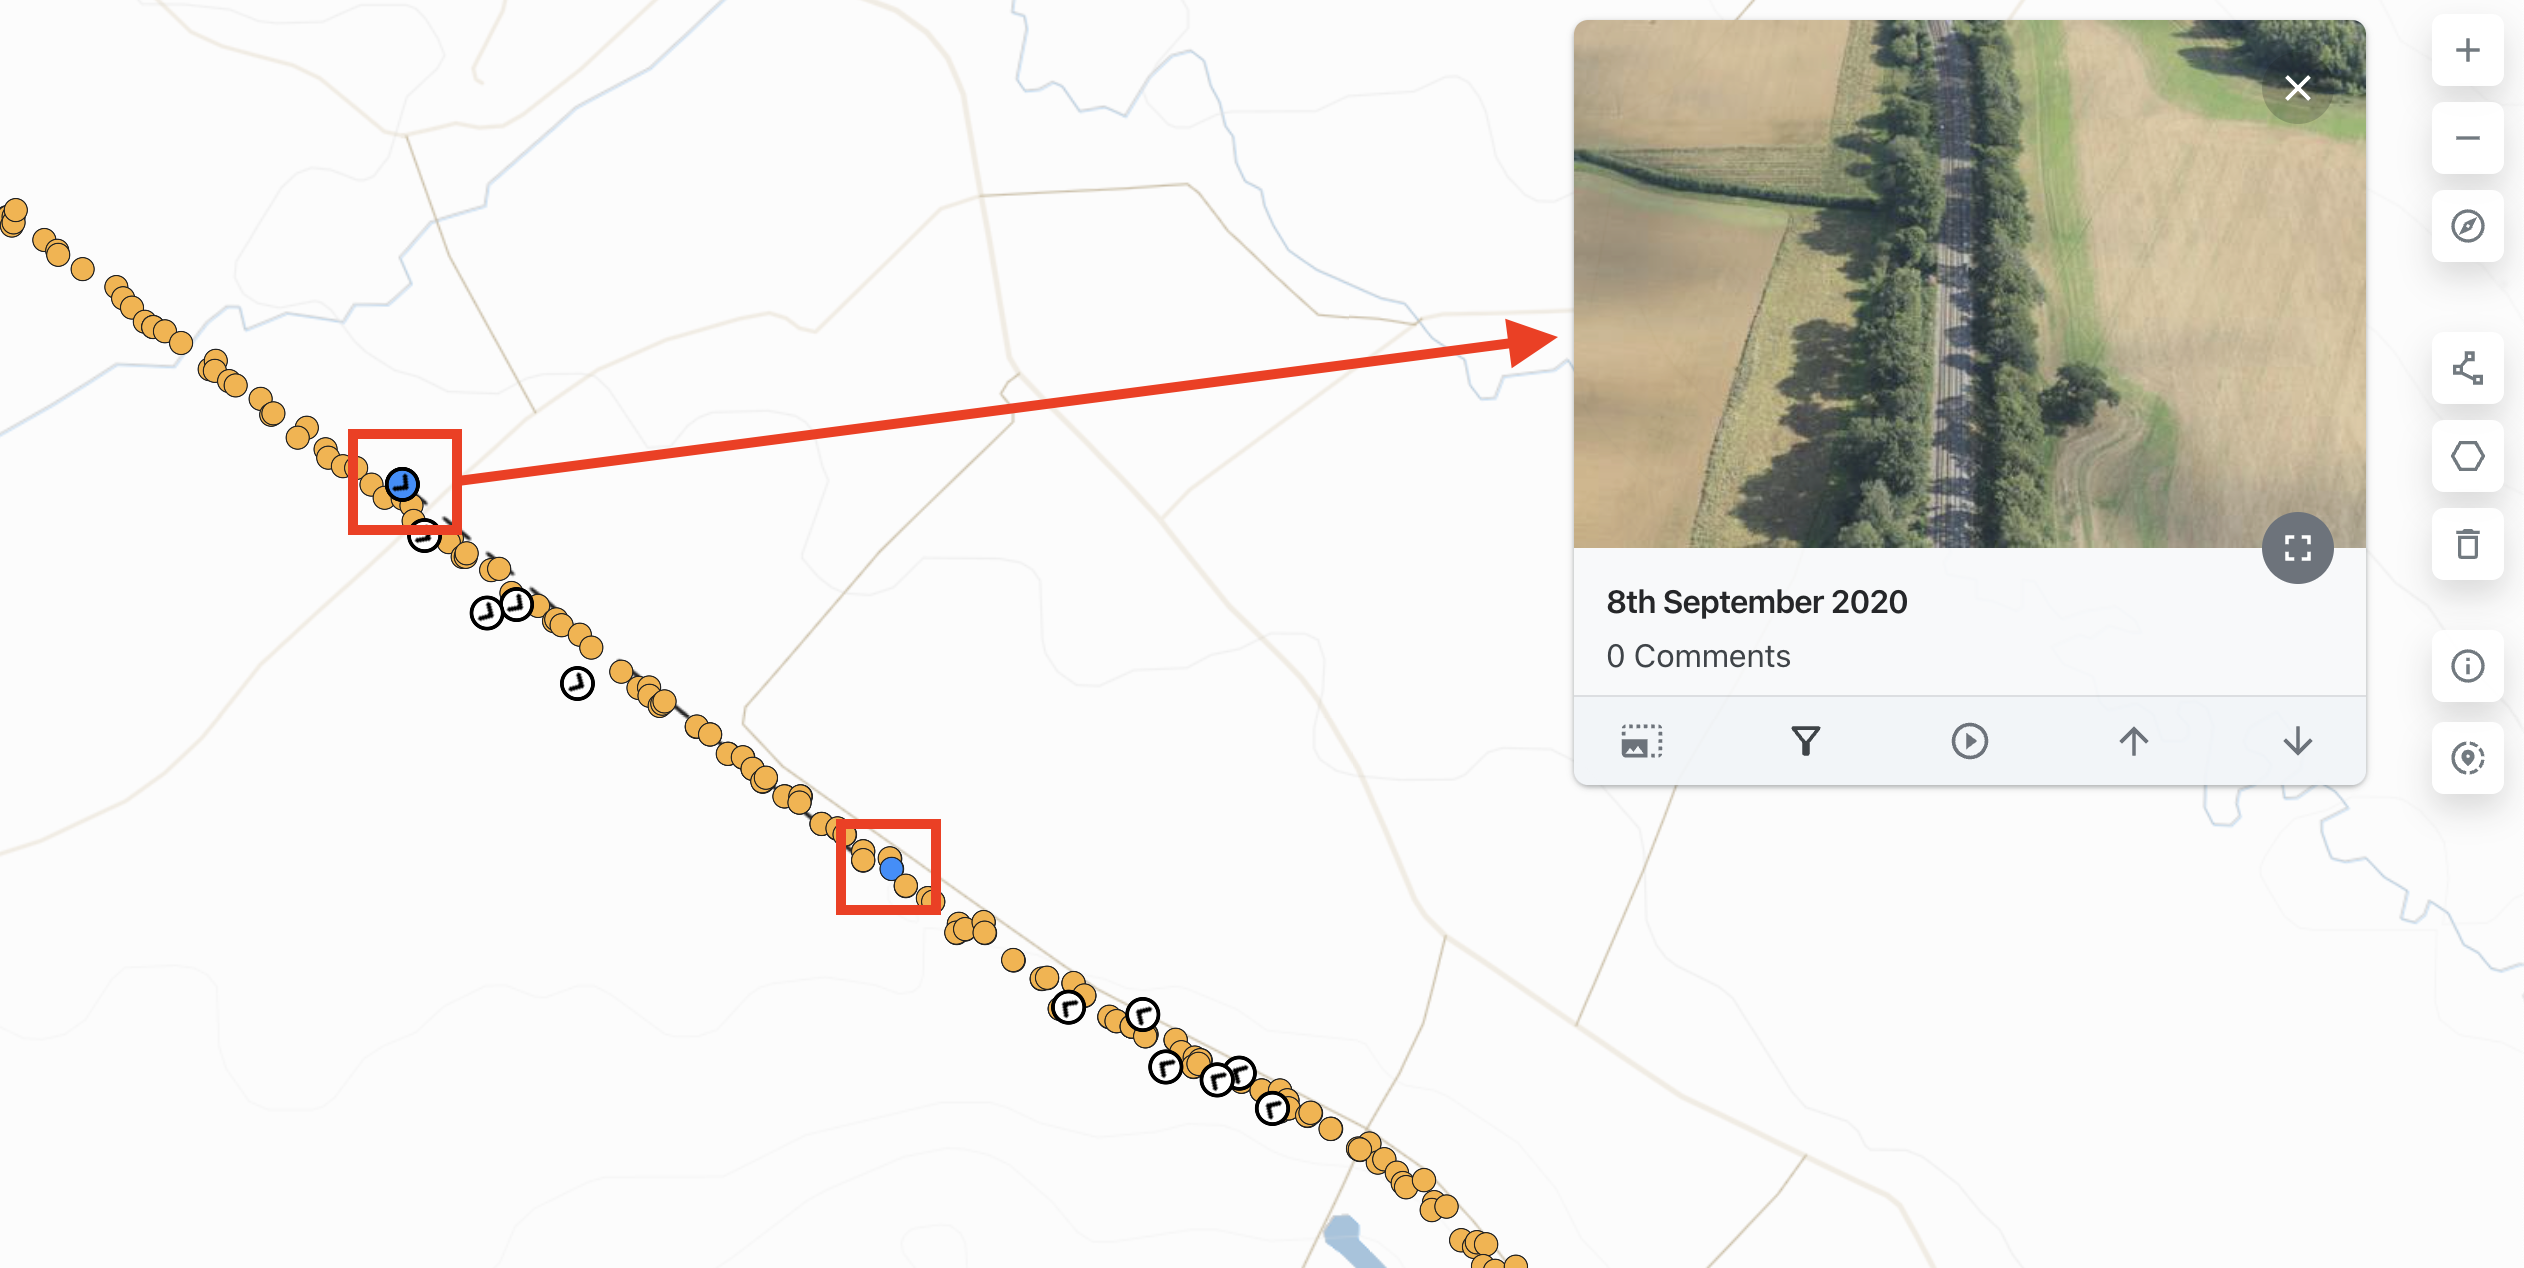
The image card also gives information such as time and date taken and can be made larger and smaller as required:
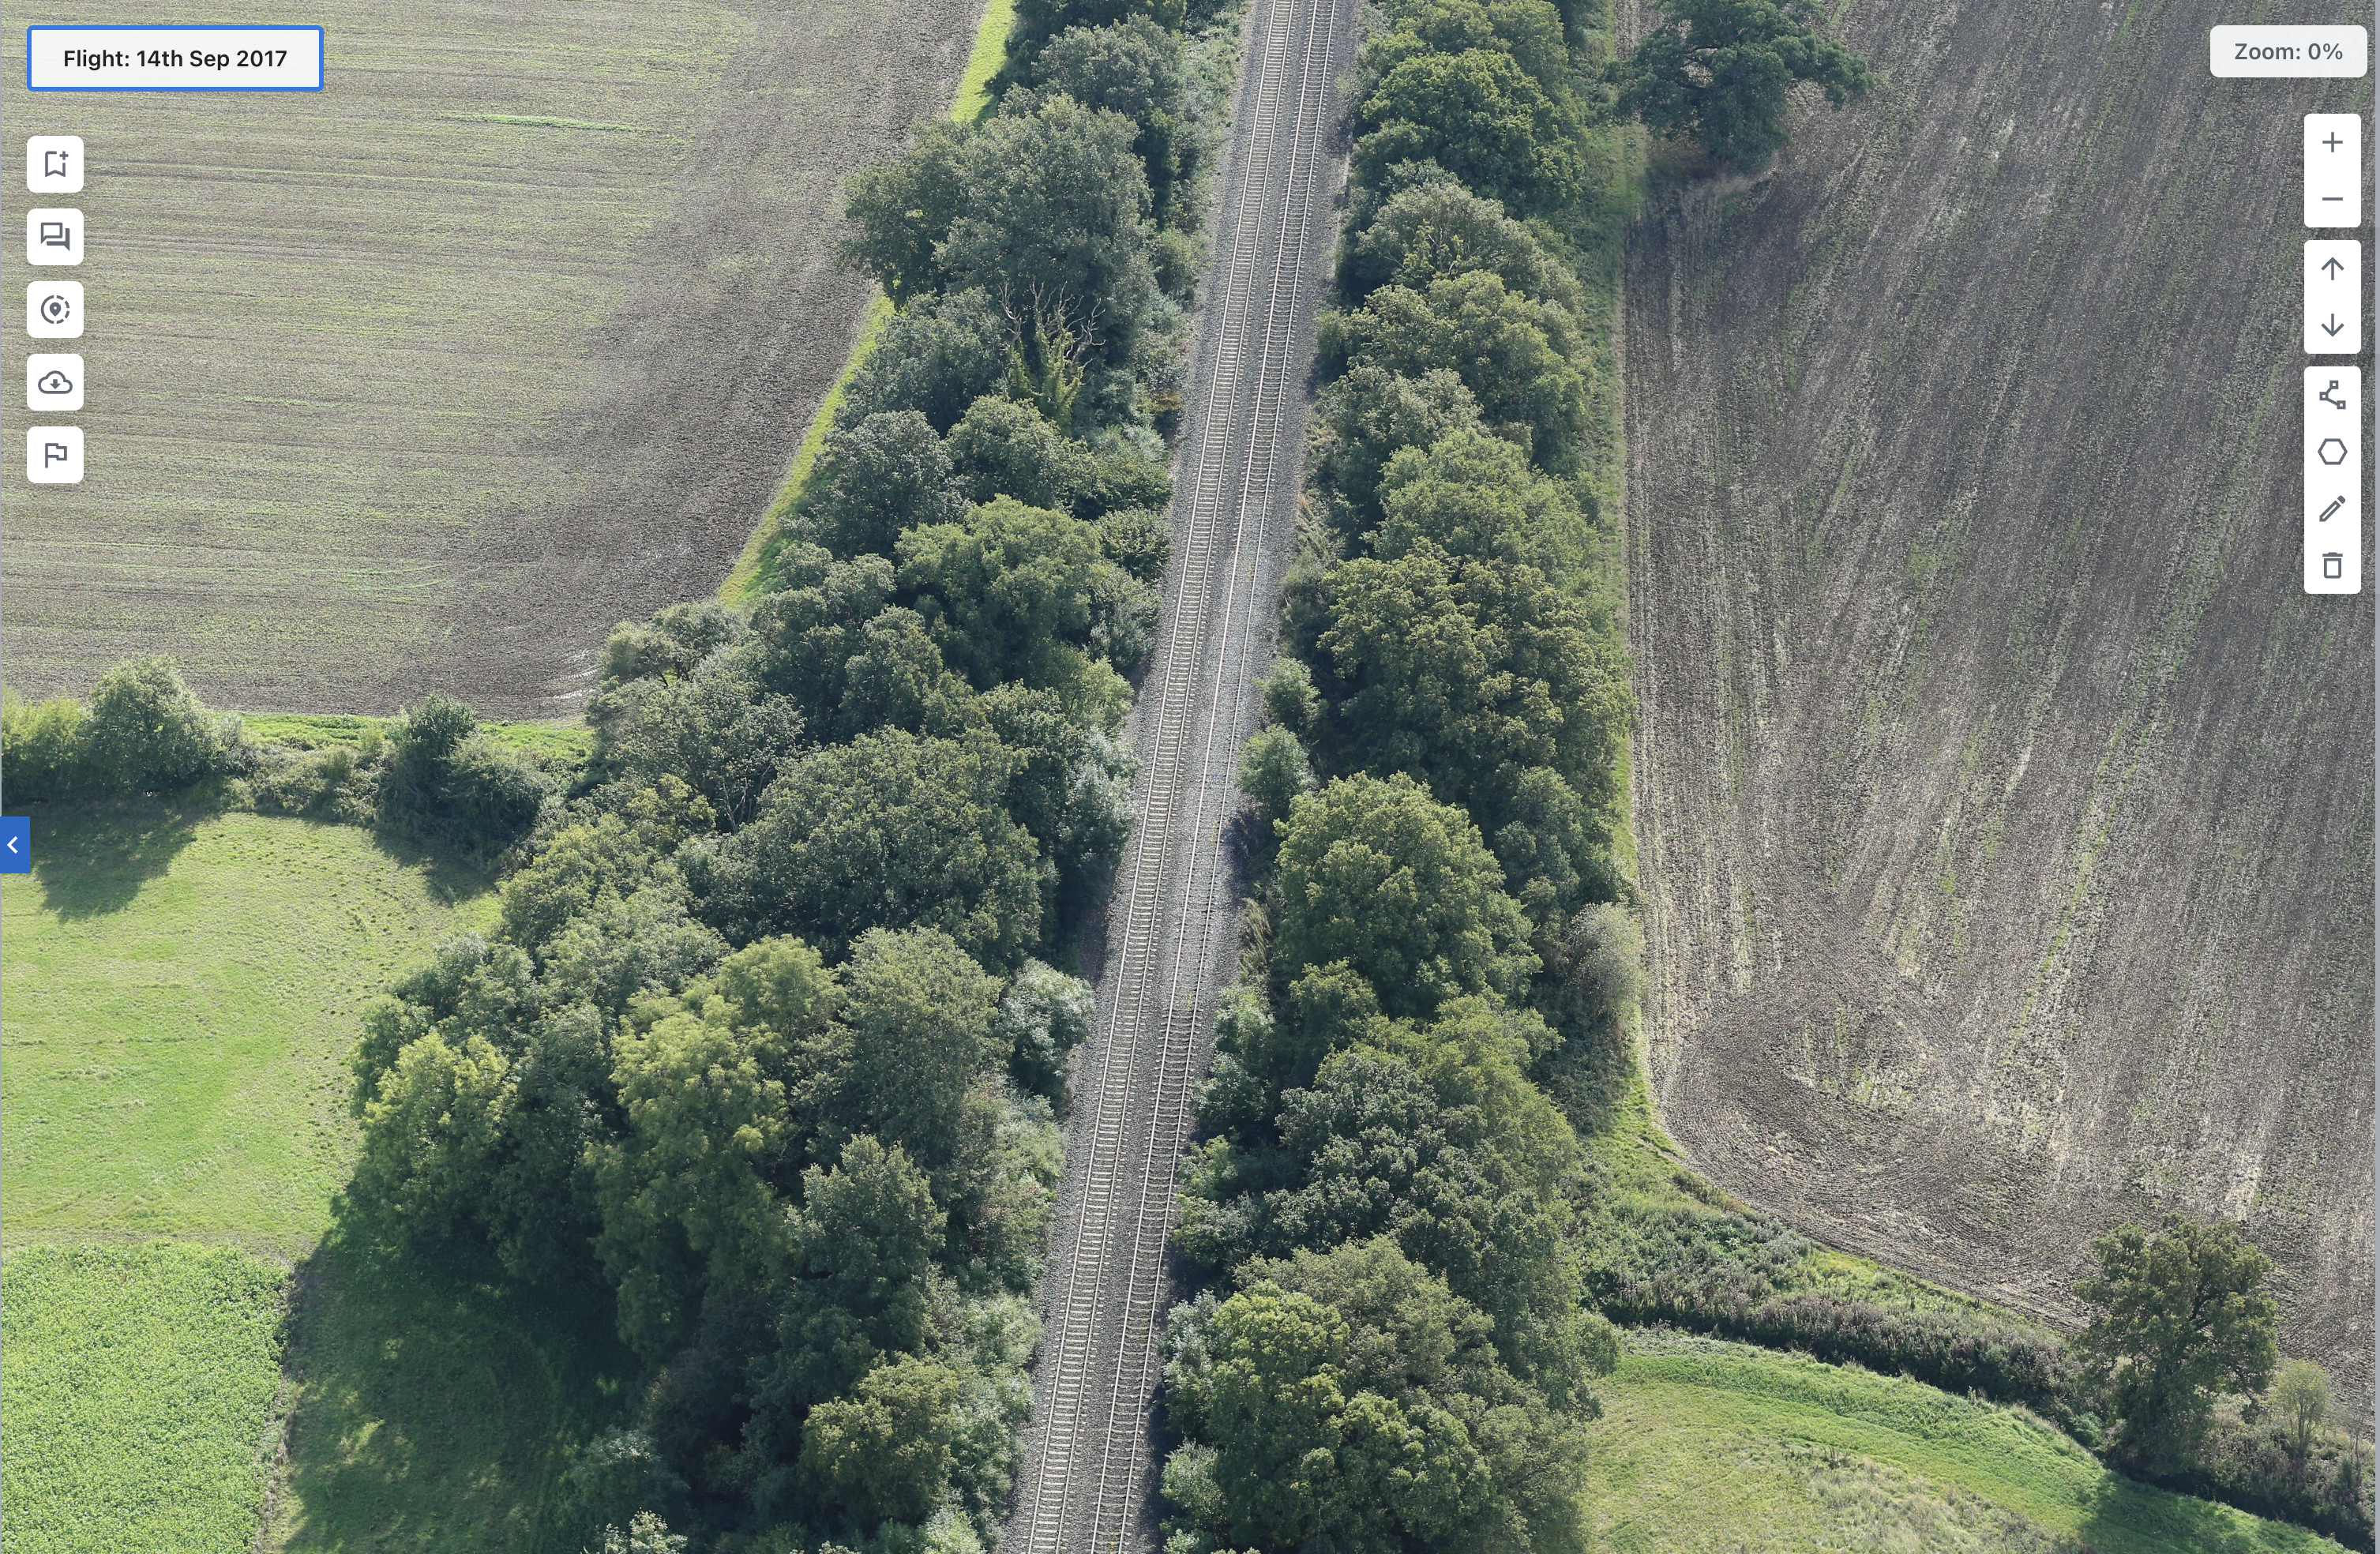
By clicking on the box on the right of the image, a full screen, high resolution version of the image will appear, allowing you to zoom in, analyse, take measurements and obtain feature information.
Click here for more information about the Image Card